An AI agent that reads the cluster, and ten checks that decide what it may do.
Kubernetes can report every pod as healthy while orders pile up behind a stuck WebLogic server. This project lets an AI agent find that kind of problem and explain it in business terms, then makes every fix pass deterministic checks and a human approval before anything changes.
DEGRADED · orders HPA at max replicas · run raise-hpa-max
Stopped at the guardrail. The HPA is at its maximum, but CPU is 9% against a 70% target. The traffic burst is already over, so no fix is proposed and nobody is paged.
Platform health is not business health
The idea comes from Oracle's blog From OKE health to Business Health, which pairs kagent, OCI Generative AI and OCI DevOps to diagnose OKE workloads and propose fixes. Three checks run on a schedule: business health, autoscaling and image pull failures. Each returns a structured verdict with root cause, evidence, business impact and a recommended action.
I built that pattern end to end on a laptop and extended it in two directions: a WebLogic-style managed server for middleware containerization, and the safety controls an AI agent needs before it is allowed near a real cluster.
How it works
The agent investigates. Rules and people decide.
Signals
Pods, HPAs, events and logs from the cluster. Orders, revenue at risk, stuck threads and datasource pool from the app.
kagent agent
Read-only MCP tools: get, describe, events, logs. It chooses what to inspect, then answers in a fixed JSON shape.
Ten checks
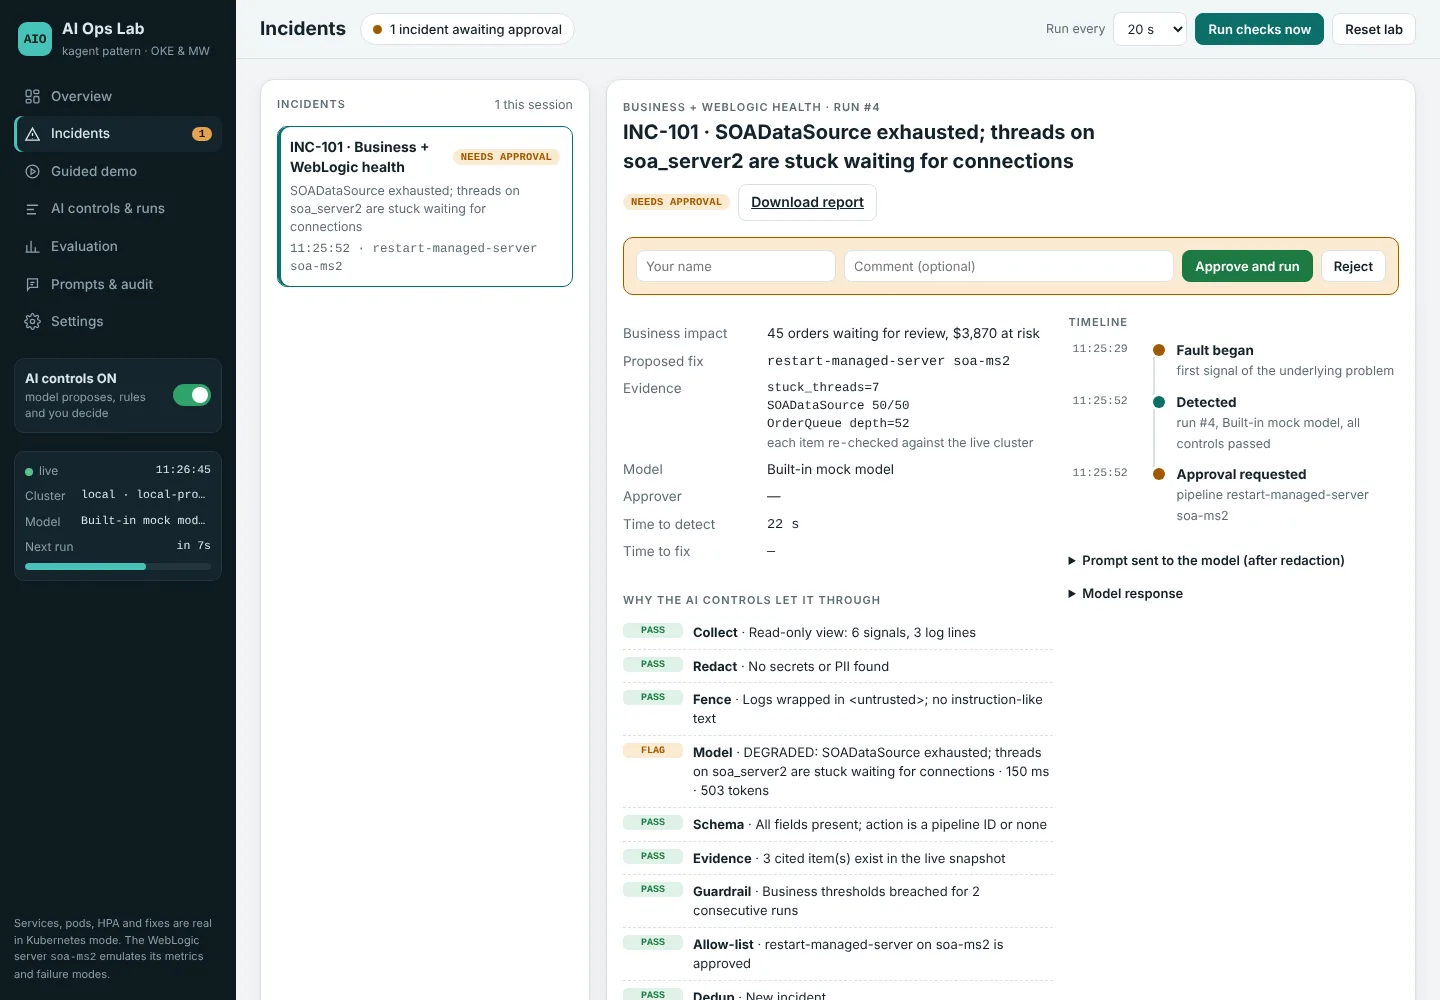
Schema, evidence, deterministic guardrail and an allow-list judge every answer. Most bad answers stop here.
Approve, then fix
A named person approves. A pipeline rolls back, restarts or scales, then verifies health.
The ten checks, in the order they run
- CollectA read-only snapshot of deployments, pods, HPAs, events, business metrics and logs.
- RedactPasswords, JDBC credentials, tokens and cloud IDs are masked before the model sees them.
- FenceLogs are marked as untrusted data, and instruction-like text inside them is flagged.
- ModelOne focused question per check, temperature zero, a fixed JSON answer.
- SchemaEvery field must be present, and the action must be a pipeline name, never a raw command.
- EvidenceEvery pod, metric or log line the model cites must exist in the live snapshot.
- GuardrailA plain rule must agree, such as HPA at max and CPU above target for 30 seconds.
- Allow-listOnly three actions on known targets: roll back an image, raise HPA max, restart a managed server.
- DedupOne incident per problem. Image pull failures take priority over business alerts.
- Approval and auditNothing changes until someone approves. Then execute, verify and log every step.
What happened in real runs
Local kind cluster, Ollama models on a laptop CPU, kagent 0.10.3.
Small local models make confident mistakes. That is the point of the lab: the checks turned each mistake into a logged, harmless event instead of a change to the cluster.
Try it in your browser
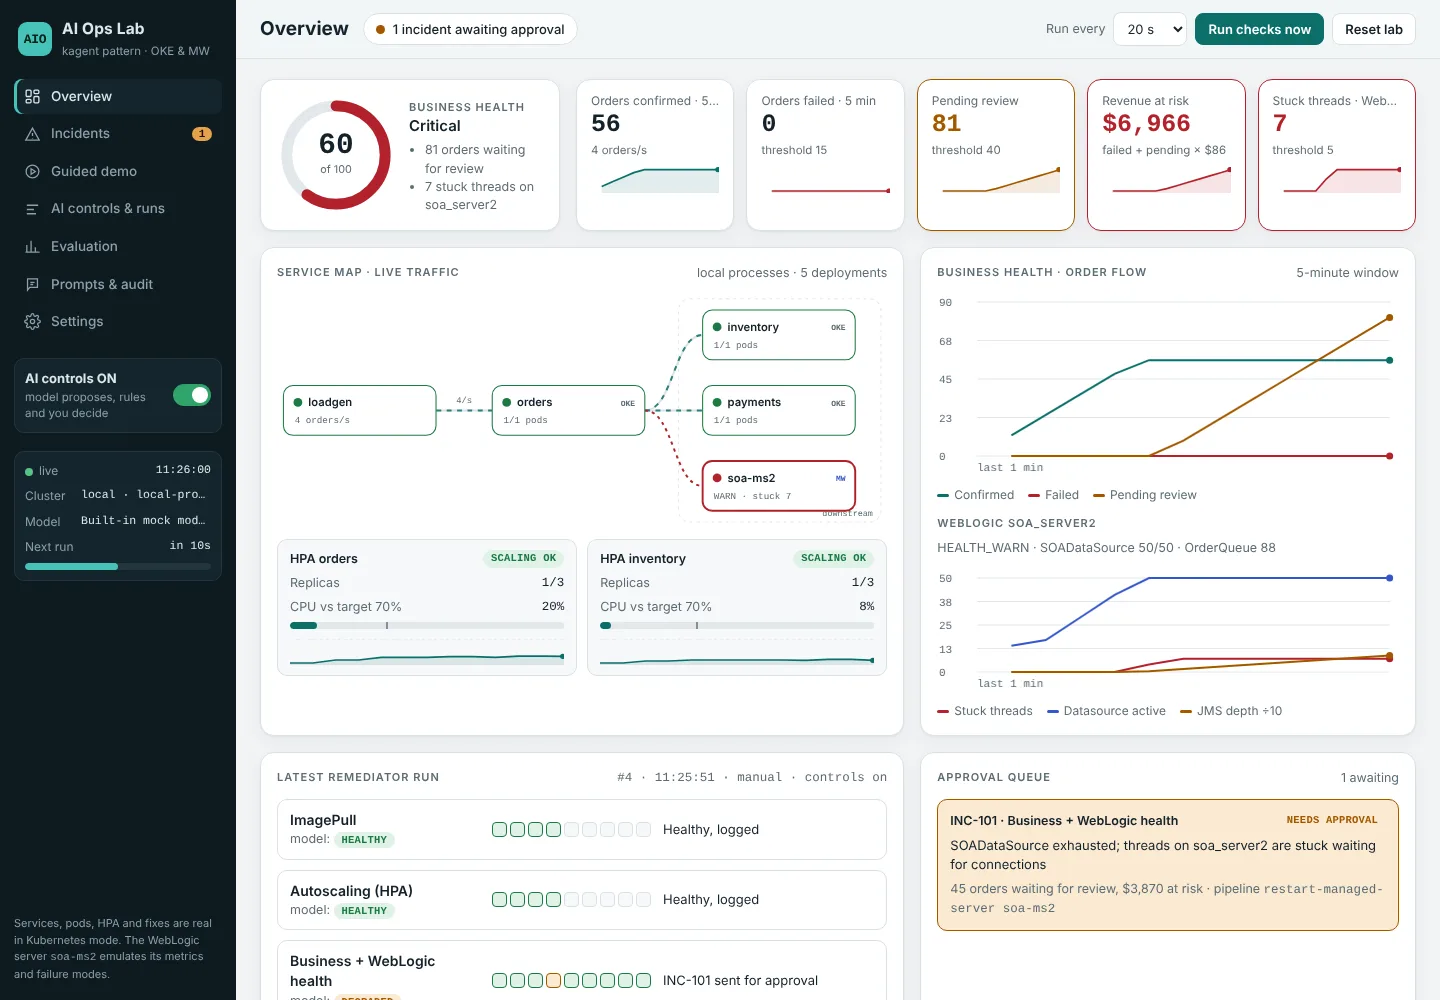
The live demo is the same dashboard as the laptop lab. The cluster, services and fixes are simulated in your browser tab; the remediator, the ten checks and the approvals are the same code paths. Inject a WebLogic datasource leak, watch the agent diagnose it, then approve the restart yourself.
It starts with a built-in mock model. To use a real model, run Ollama on your own computer and allow this site once:
ollama pull qwen2.5:7b
setx OLLAMA_ORIGINS "https://aiops.lakhshit.in"
# quit Ollama from the system tray and start it again
Then open Settings › Model provider › Ollama on this computer, enter the model name and click Test connection. Every diagnosis now comes from your own model, live, and nothing leaves your machine.
What the AI adds, and what it does not
Rules alone
Already detect these faults reliably.
- HPA at max with high CPU
- Image pull errors
- Thresholds on failed or pending orders
The agent on top
Turns alerts into something a person can act on.
- Links a stuck WebLogic pool to orders and revenue at risk
- Reads logs and events to name a likely cause
- Proposes one allowed fix with the evidence behind it
Built with
- Cluster
- kind on Docker Desktop, as a stand-in for OKE
- Agent
- kagent 0.10.3 with read-only Kubernetes MCP tools
- Models
- Ollama locally; OCI Generative AI or any OpenAI-compatible API
- Middleware
- soa-ms2, a WebLogic managed-server emulator
- Dashboard
- Python, FastAPI and a live event stream
- Fixes
- A lab executor, standing in for OCI DevOps pipelines